


In this article Professor Steve Chinn explains how data visualisation, or the use of visual images and maths equipment, can enhance maths learning.
I’m sometimes behind the curve. Well, not always totally, but sometimes missing a vital link, not making a connection. So, recently I have noticed the phrase ‘data visualisation’. It seems to be a relatively recent discipline, at least in its title.
To me it looks like something that does, ‘what it says on the tin’. Specialists and companies offer to take data and present it visually in order that people can better understand it. To me that seems like using visuals and materials to help children learn maths more effectively.
Using visual aids and materials is something that goes back a long time in maths education and brings to mind names like Cuisenaire rods, Diene’s blocks, the abacus and bead strings. And Bruner’s stages of development, although I may have some caution about being over-specific on the age ranges attributed to them.
Yet, some teachers still resist the use of visual images and materials when teaching maths and some educators are certainly not advocates for their use. This applies particularly when pupils are beyond the early primary years. Learners are plunged into the symbols, and only the symbols, before concepts are secure.
There are exceptions, of course, notably Numicon.
I like teaching maths and learning from my students, whatever their age. I have learned so very much more from my students than I have from maths ‘educators’. And I include myself in that category. So, let me consider some examples of data visualisation I have used in my lessons and that my students have found efficacious.
The very basics
I have been saying for many years now, that teachers need to know where the maths topics they are teaching started and where they are going next. Otherwise, intervention, and the initial teaching will not go far back enough and won’t set the foundations for further development. Maybe sometimes a quick revisit and refresh is enough to get them back into the ball-park.
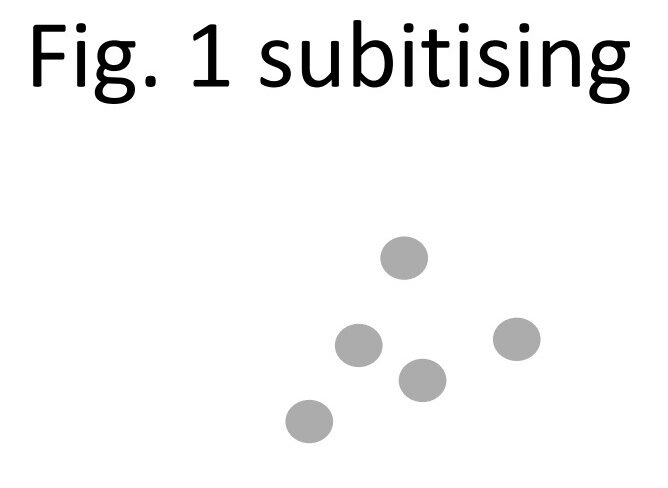
Subitising is one of the key factors in the early diagnosis of dyscalculia. This is basic quantity recognition, coupled with knowing the number name of quantities up to 5 (Fig 1).
This is followed by counting up to 10 (Fig 2) and beyond and then by basic addition facts to 10. 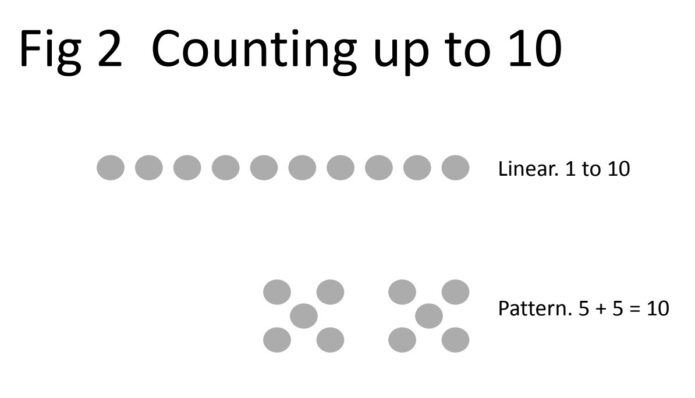
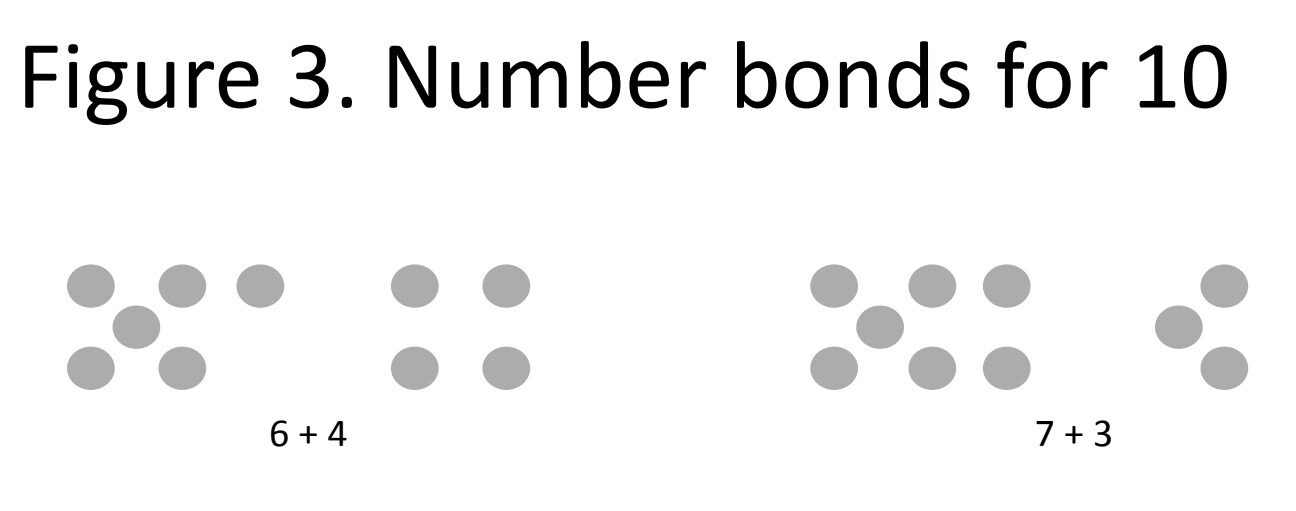
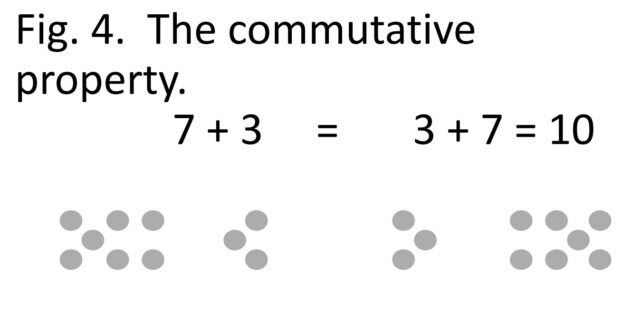
Even early number work is rarely a single focus, which is where a teachers skills come in. Figure 1 shows a linear visualisation of 10. The first nine numbers are single-digit. 10 is two-digit. Figure 2 suggests that 10 can be visualised as 5 and 5, as with the fingers on our hands. It is a visual pattern, an organisation of 10 into a recognisable and hopefully quantifiable image and pattern. Adjustments to the 5 + 5 image should show the conservation of number (Fig 3) and possibly the commutative property of addition, even if we don’t introduce such 4-syllable words at this stage (Fig 4).
Beware inconsistencies
There are many examples of misleading inconsistencies in early maths. Visualisation is needed to support abstract ideas. For example, those first 2-digit numbers where the vocabulary does not support the images. Visuals are essential to embedding the correct information and concepts.
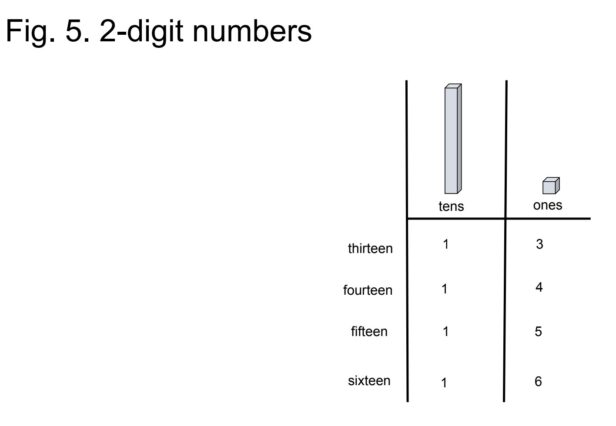
The names of the first 2-digit numbers, in the English language, do not support the order of the digits and the first exposure to place value. Eleven and twelve are exceptions and the teen numbers have a syllable structure that is opposite to the digit order. Thus, we say ‘thirteen’ and write 13. We revert then to twenty-three, thirty-three and onwards, writing 23, 33, 43 and onwards. The data visualisation I use here is based on base ten blocks, possibly enhanced by place value columns (Fig 5). This representation uses scaffolding where the scaffolding is removed in stages as the building of the concept becomes more secure and the inconsistencies of the teen numbers are addressed.
Fractions
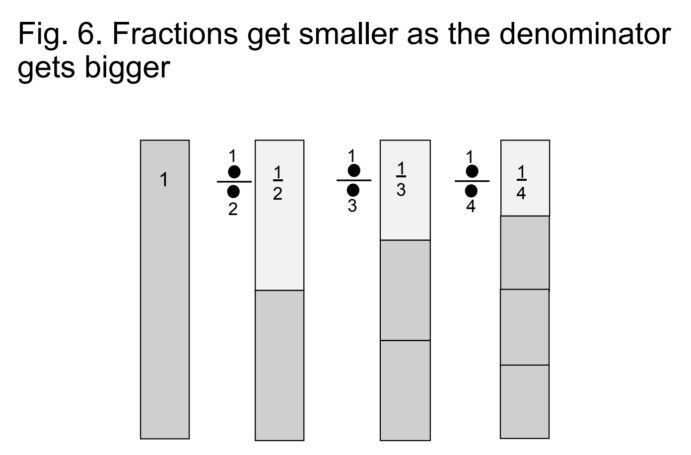
Over the decades that I have been presenting maths lectures to teachers I have asked the question, ‘Which maths topics do your students like the least?’ Not surprisingly one of the top answers is ‘fractions’. This, for me, is a top topic for data visualisation. It also is a top topic for perceived inconsistencies, which, of course, I think can be addressed with visualisation.
As with the first 2-digit numbers, the early vocabulary for fractions involves ‘half, third and quarter’ none of which fit the pattern of ‘fifth, sixth, seventh’ and so forth. A symbol challenge is that the digit format for fractions does not show the division sign overtly, so 1⁄2, 1⁄4 for example, are not shown as 1÷2 and 1÷4.
The visualisation should show the dividing up into equal parts to make fractions and that the more the divisions, the smaller the parts. It is possible to take paper strips and physically cut, or divide, them into equal parts thus visualising ‘division’ and the consequence that, for example, 1/4 is smaller than 1/2 (and maybe that it is half as big as well). (Fig 6). Later I will develop the strips into areas for more complex procedures such as 2/5 x 3/7.
Finally
Misconceptions can start very early when children learn maths, and often stay with them for many years. Visualisation will help address this problem. Visualisation is not just for basic maths, in much the same way as experiments in physics and not exclusive to basic studies. It is also worth noting that the first time we learn something new it can be a very dominant and persistent memory in the brain and thus hard to unlearn. My contention is that using visualisation reduces that possibility.

Author: Prof Steve Chinn
numeracy

Prof Steve Chinn
Prof Steve Chinn was a teacher for many years. He was Head of 3 specialist schools for SpLD students, one of which, a Beacon School, he founded. He has written several books including 'The Trouble with Maths' which won a TES award. Steve has lectured and trained teachers in over 30 countries.
Website : mathsexplained.co.uk
Twitter : @stevechinnUK


